Eleven photographs of a handwritten notebook, shared on 2026-10-30. Each one is shown with what is on it and what the
code made of it. The full transcription with the settled parameters is data/trading/trading-plan.md.
Settled 2026-10-30: range High to Low · wide bar 3× prior · swings from pivots · channel 20 bars, tight ≤ 4 ATR, wide ≥ 6 ATR · equal within 1 ATR · clear air 3 bars · daily bars
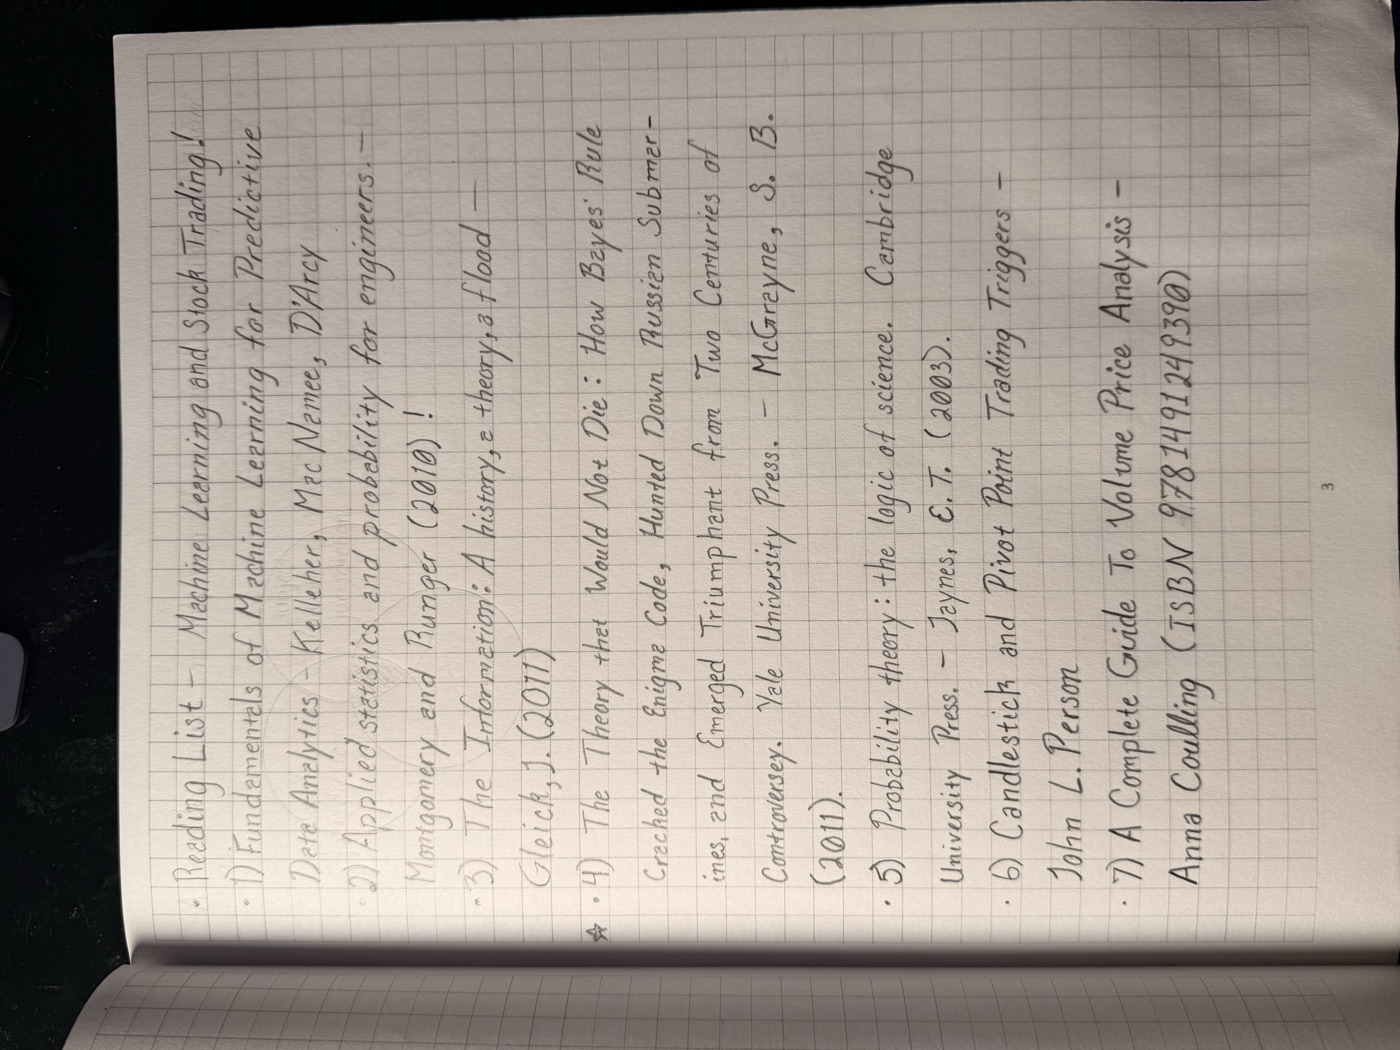
Seven books, from machine learning and probability to candlestick triggers and volume price analysis. The starred one is McGrayne's history of Bayes' rule.
| Item | As written | In the code | |
|---|---|---|---|
| Kelleher, Mac Namee, D'Arcy | Fundamentals of Machine Learning for Predictive Data Analytics | The source of the statistics review on page 5. | context |
| Person; Coulling | Candlestick and Pivot Point Trading Triggers; A Complete Guide to Volume Price Analysis | Where the chart components on page 9 come from. | context |
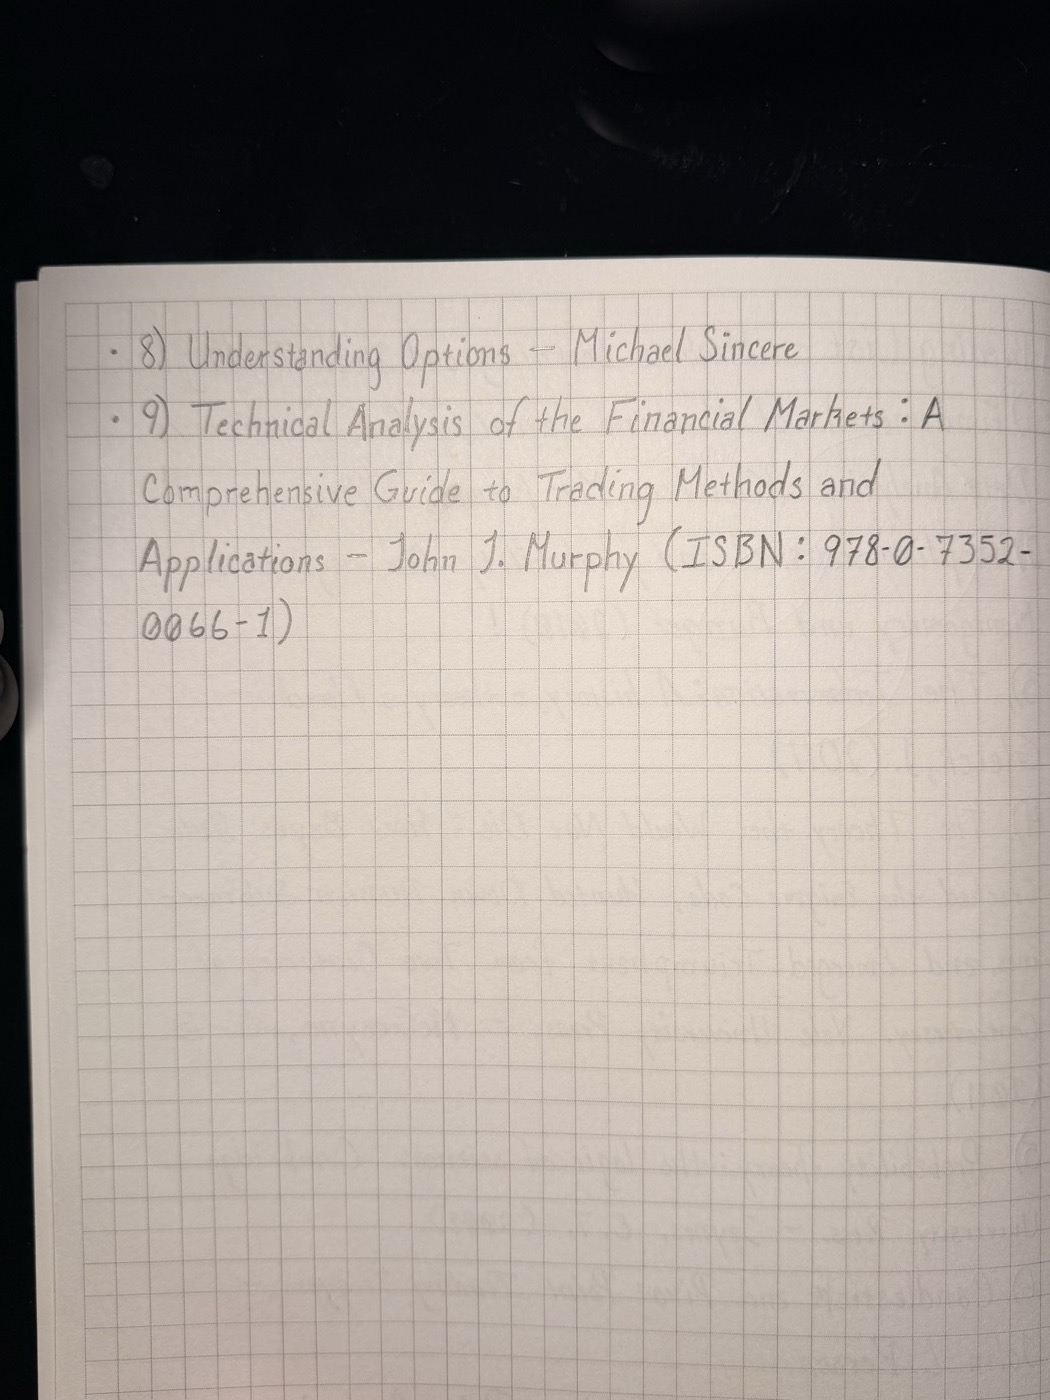
Two more: Sincere on options and Murphy's Technical Analysis of the Financial Markets, the standard reference for trend and range definitions.
| Item | As written | In the code | |
|---|---|---|---|
| Murphy | Technical Analysis of the Financial Markets | Murphy defines a bar's range as High to Low, which is what decision 1 adopted. | context |
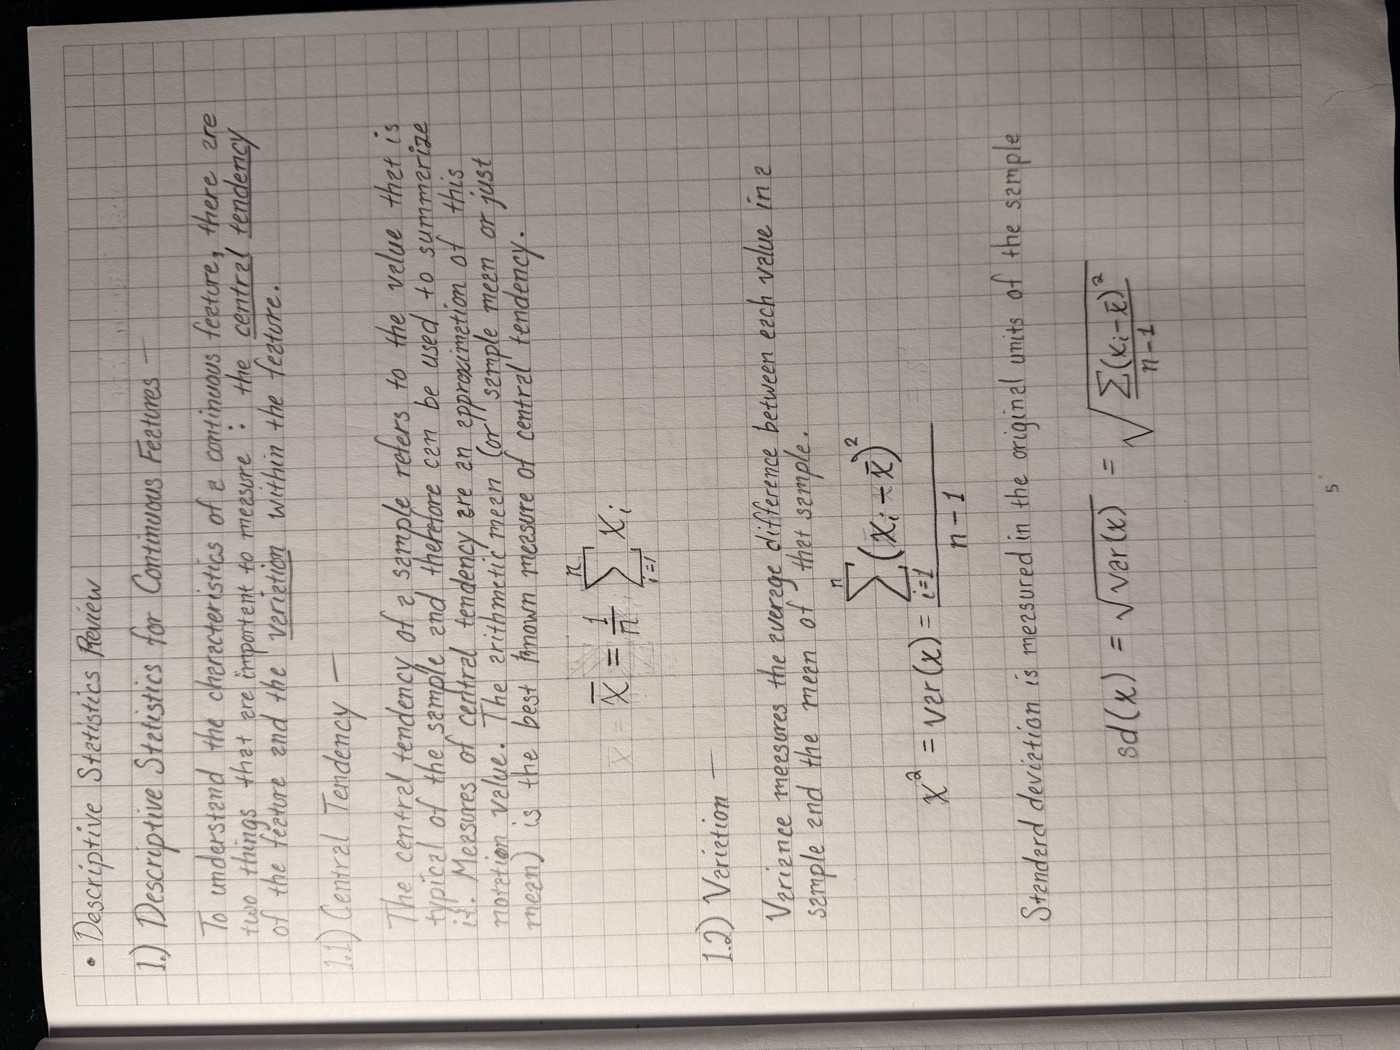
Mean, variance, and standard deviation for a continuous feature, copied from Kelleher. Background for the ATR and the channel measures, not a rule.
| Item | As written | In the code | |
|---|---|---|---|
| Mean and standard deviation | Central tendency and variation of a sample | The 14-bar average true range is the plan's unit of variation; every tolerance is stated in ATR. | context |
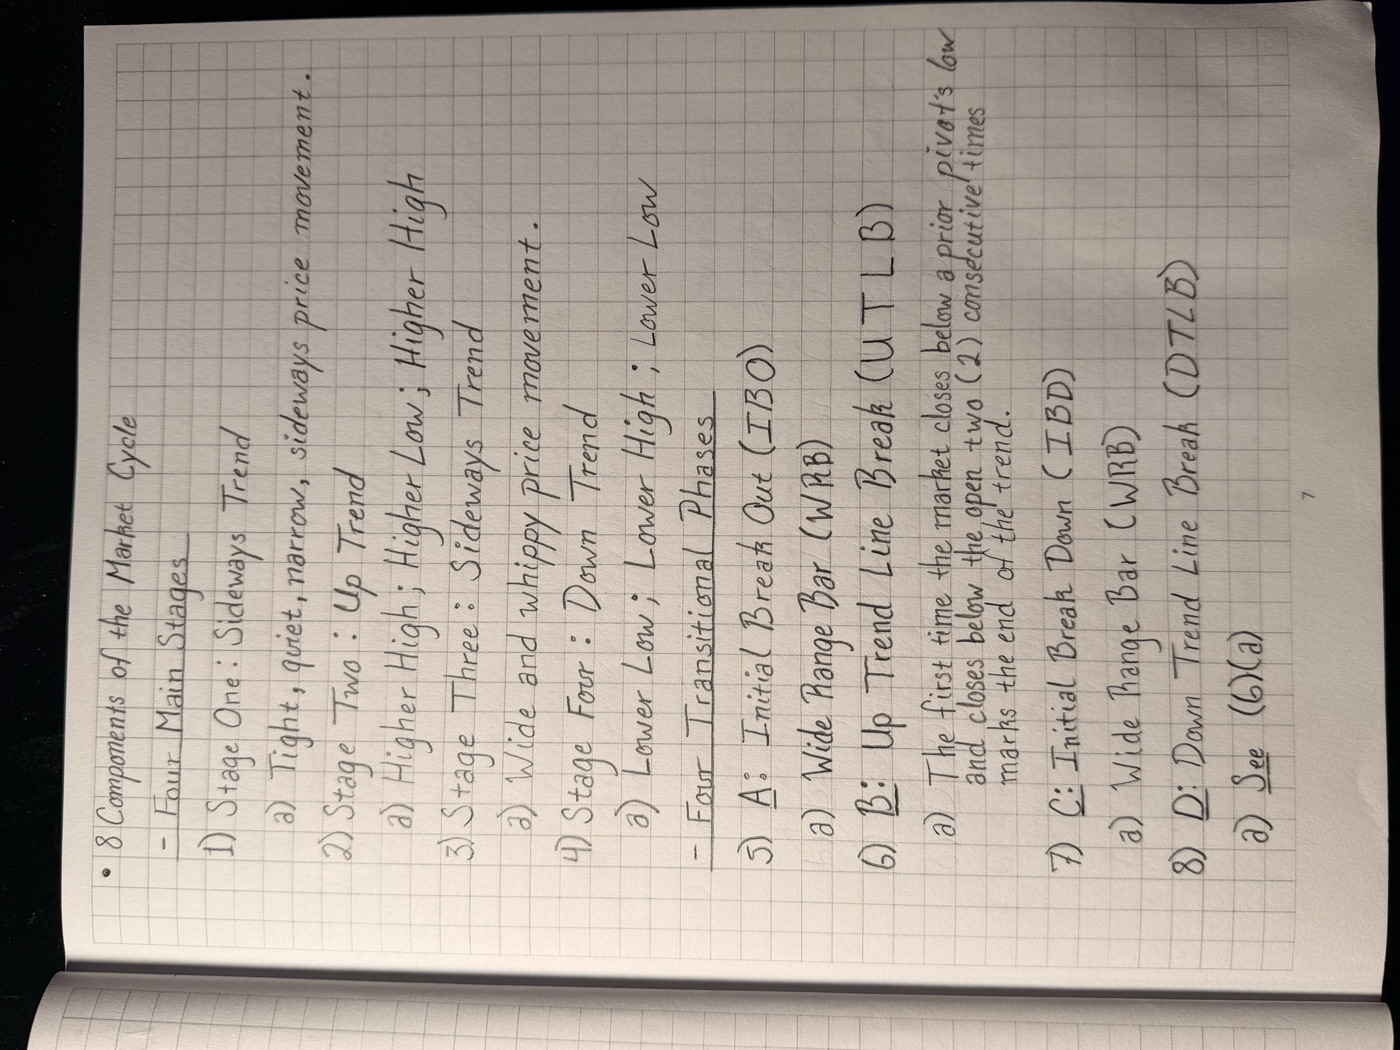
Four stages and four transitions. The stages are the coloured bands on the chart; the transitions are the marks.
| Item | As written | In the code | |
|---|---|---|---|
| Stage One, sideways tight | Tight, quiet, narrow, sideways price movement | A 20-bar channel of at most 4 ATR (decision 4, raised from 3 after the sweep). Blue band. | coded |
| Stage Two, up trend | Higher high, higher low, higher high | Last two swing highs and lows both rising. Green band. | coded |
| Stage Three, sideways wide | Wide and whippy price movement | A 20-bar channel of at least 6 ATR. Amber band. | coded |
| Stage Four, down trend | Lower low, lower high, lower low | Last two swing highs and lows both falling. Red band. | coded |
| A: Initial Break Out | A wide range bar | A wide up bar into clear air on the bar after a Stage One base. Green triangle. Rare by construction: 0 to 4 in five years. | coded |
| B: Up Trend Line Break | First close below a prior pivot's low, and two consecutive closes below the open | Exactly that, in Stage Two, once per trend. Red cross. | coded |
| C: Initial Break Down | A wide range bar | A wide down bar into clear air out of a Stage Three top. Red triangle. | coded |
| D: Down Trend Line Break | See B | The mirror of B, in Stage Four. Green cross. | coded |
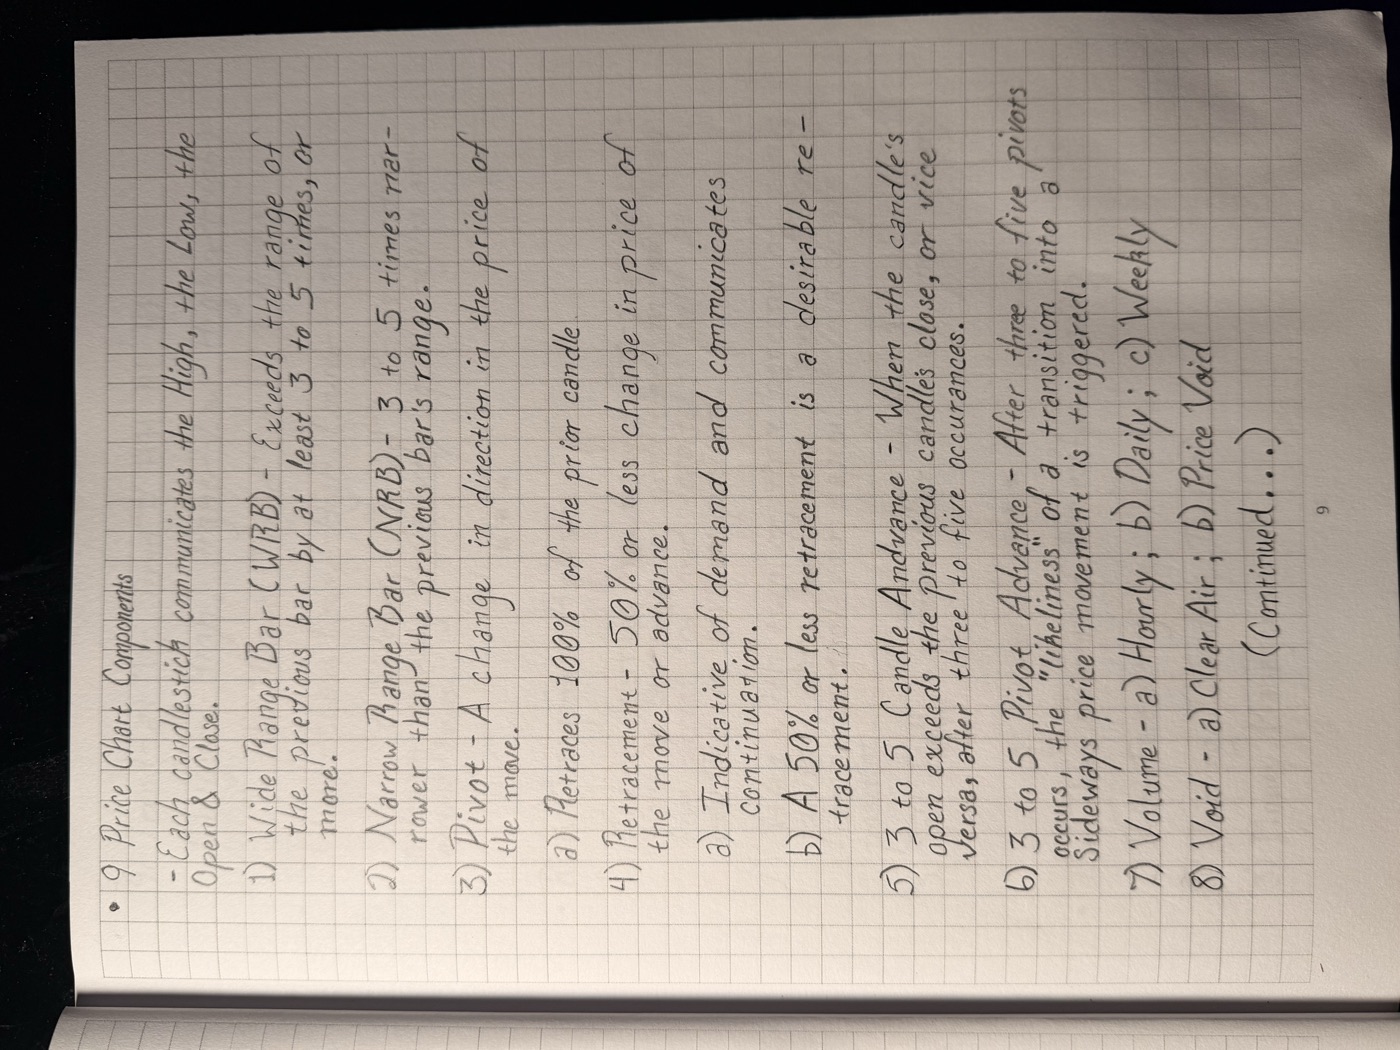
The vocabulary of a candle chart as the plan uses it. Seven of the nine became computed features; two are context.
| Item | As written | In the code | |
|---|---|---|---|
| Wide Range Bar | Exceeds the previous bar's range by 3 to 5 times | Range at least 3 times the prior bar's (decision 2, the loose end). Drawn as a filled candle. An ATR reference exists as a trial and is stricter. | coded |
| Narrow Range Bar | 3 to 5 times narrower than the previous bar | Range at most one third of the prior bar's. | coded |
| Pivot | A change of direction that retraces 100% of the prior candle | An opposite-colour bar whose close recovers the prior bar's open. One bar by default; two or three bars are a trial on the chart. | coded |
| Retracement | 50% or less of the move; indicative of demand | The current move's extent over the previous move's height; at most 50% is desirable. | coded |
| 3 to 5 Candle Advance | Open beyond the previous close, three to five times | A run of three such bars sets the flag. | coded |
| 3 to 5 Pivot Advance | After three to five pivots, a sideways transition is likely | Three or more pivots in the last 20 bars sets the flag. | coded |
| Volume | Hourly, daily, weekly | Daily volume is drawn under the candles. The plan runs on daily bars (decision 6). | context |
| Void | Clear air; price void | Defined on the later page. | coded |
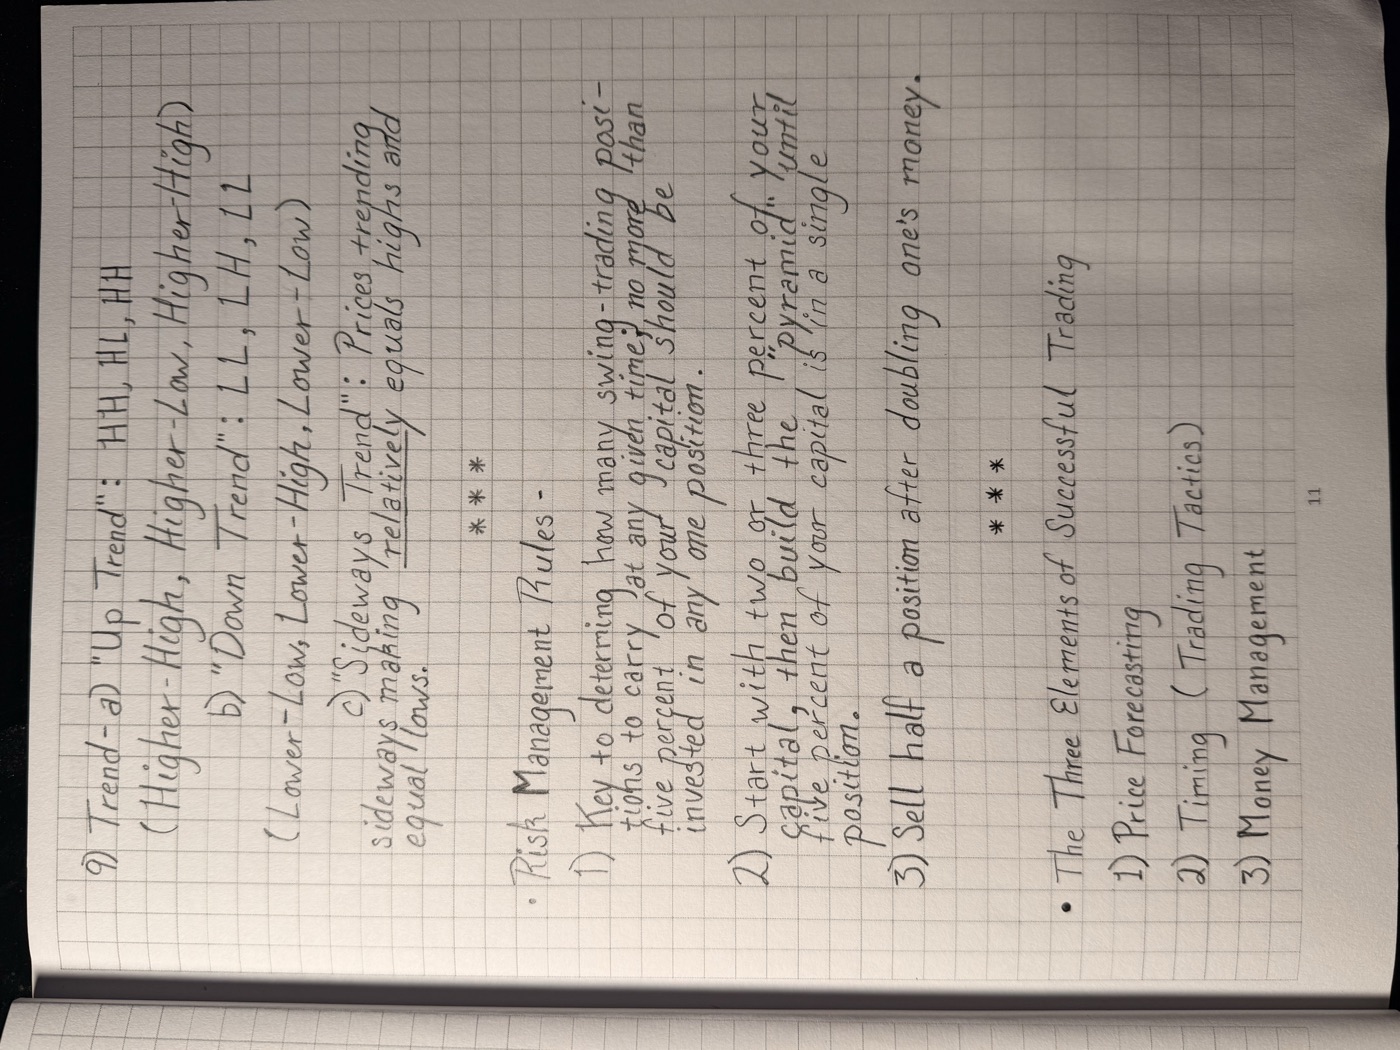
The trend definitions in letters, then the five money rules, then the headings the whole plan falls under.
| Item | As written | In the code | |
|---|---|---|---|
| Trend: HH HL, LL LH, sideways | Higher highs and lows; lower highs and lows; relatively equal | Swings come from pivots (decision 3); relatively equal means within 1 ATR (decision 5). | coded |
| Risk rule 1 | No more than five percent of capital in any one position | R1 on a position snapshot. | coded |
| Risk rule 2 | Start with two or three percent, then pyramid to five | R2. | coded |
| Risk rule 3 | Sell half a position after doubling one's money | R3. | coded |
| The three elements | Price forecasting, timing, money management | The headings of the Decision, Decision, and Rules layers. Not a rule. | context |
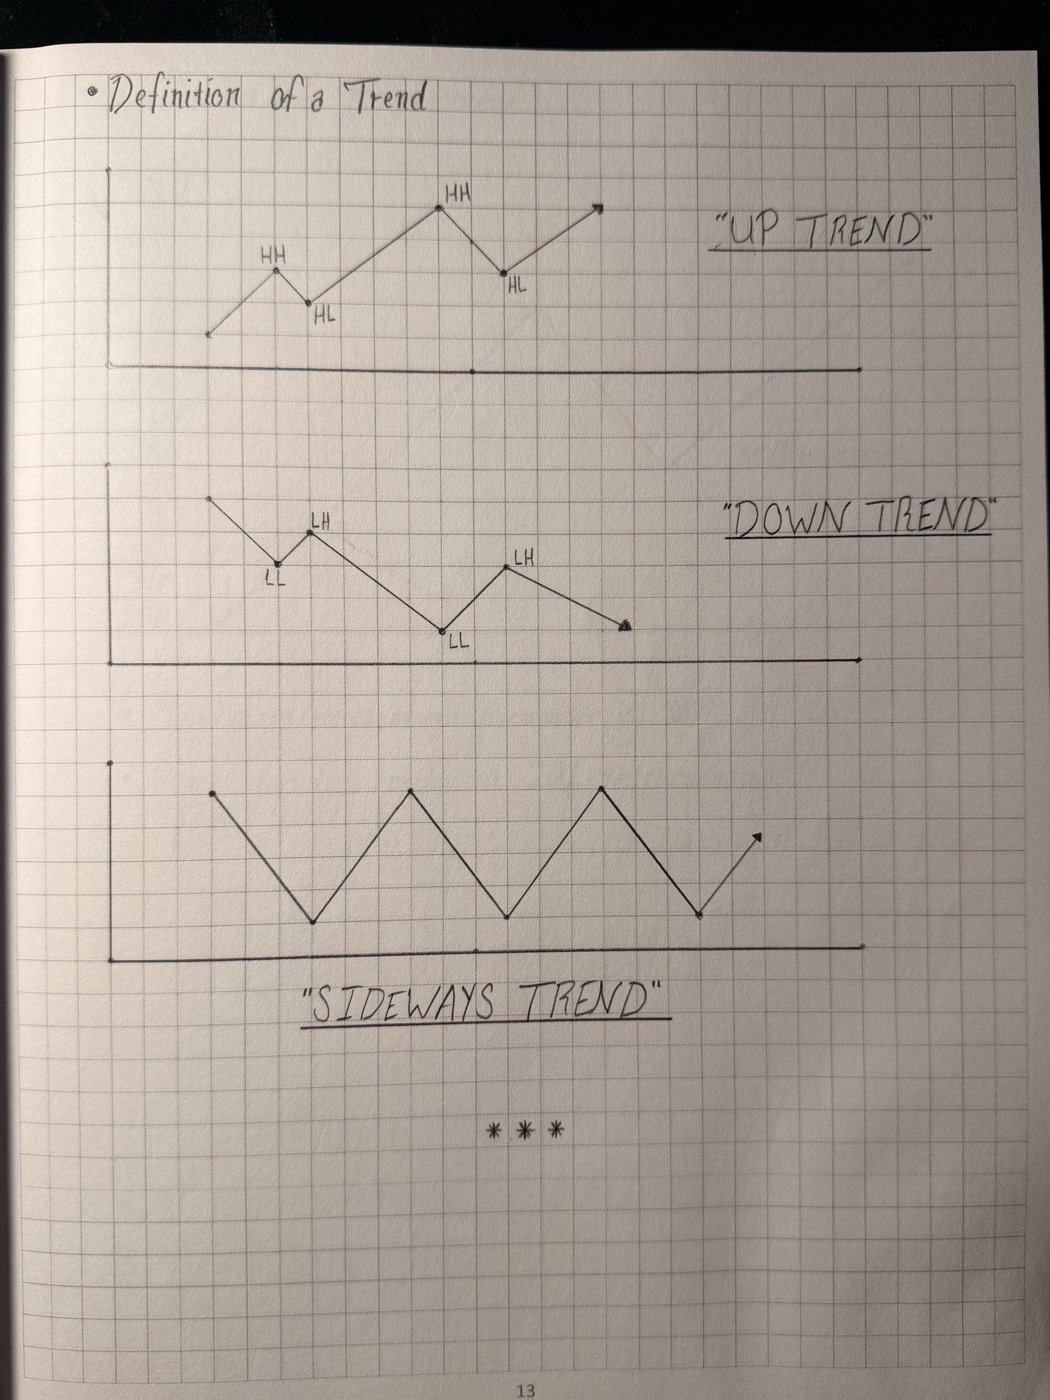
Three zigzags: rising peaks and troughs, falling peaks and troughs, level peaks and troughs. The swing circles on the chart are these points.
| Item | As written | In the code | |
|---|---|---|---|
| Swing points | The turning points of the zigzag | A swing high is the highest high of the move that ended at a down pivot, and the mirror for a swing low. | coded |
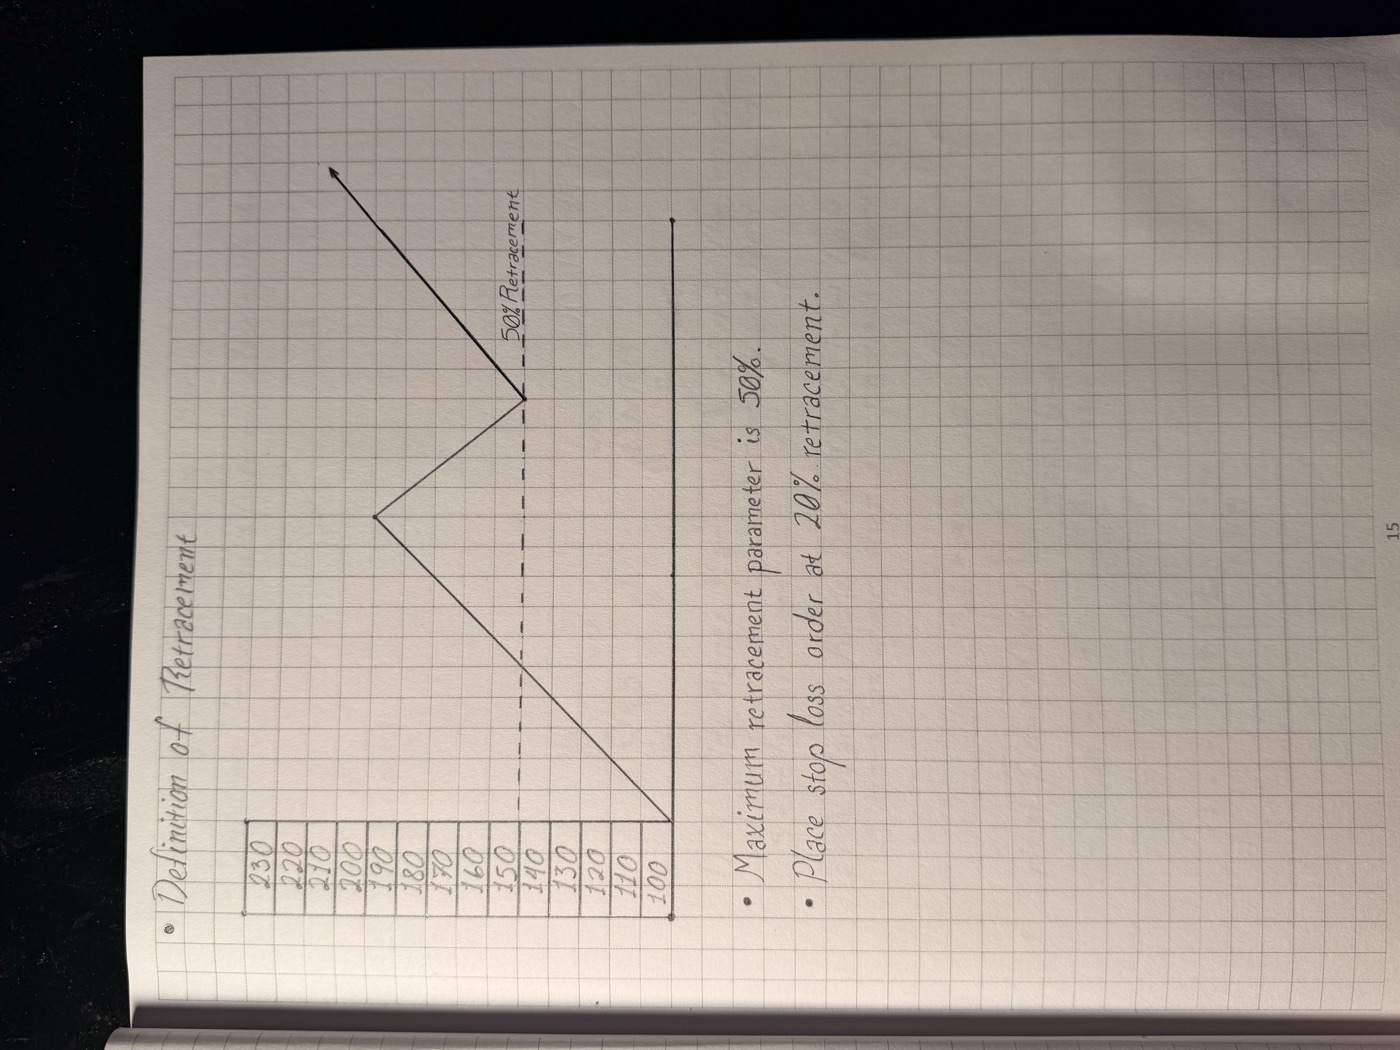
A rise from 100 to 190, a pullback to 145, and the dashed 50% line. Two numbers below it are the whole risk geometry.
| Item | As written | In the code | |
|---|---|---|---|
| Maximum retracement 50% | Maximum retracement parameter is 50% | R5: a position whose move has given back more than half is in breach. | coded |
| Stop at 20% | Place stop loss order at 20% retracement | R4, and the dashed yellow stop line on the chart: 20% down from the top of the latest advance. | coded |
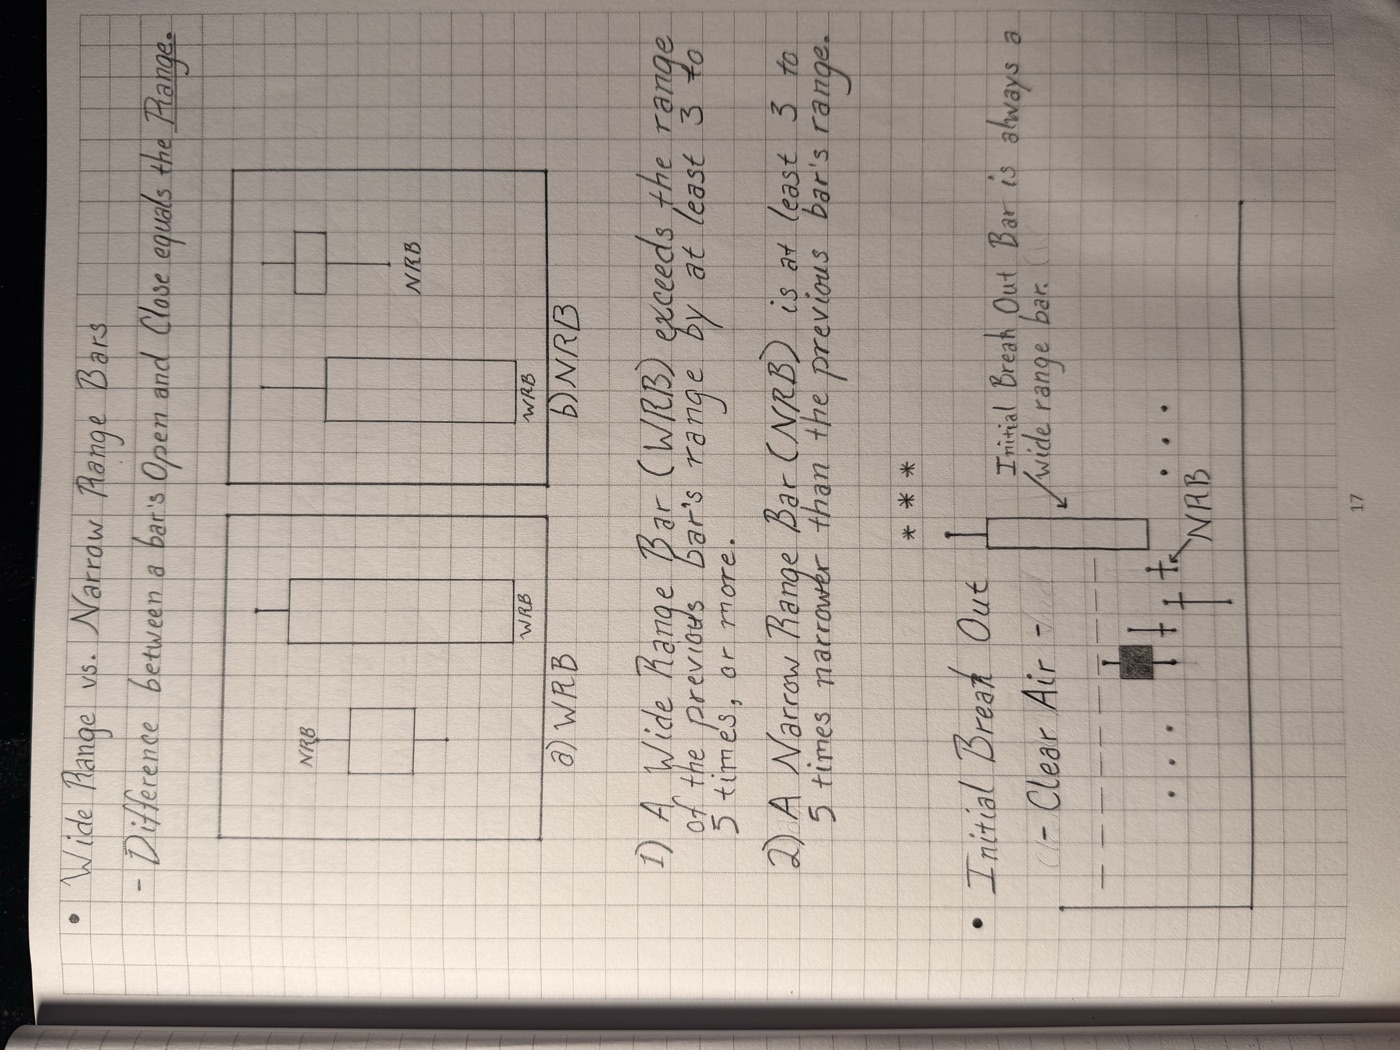
The two bar types drawn side by side, then the breakout sketch: a run of small candles, then one tall hollow candle above the clear-air line.
| Item | As written | In the code | |
|---|---|---|---|
| Range | Difference between a bar's open and close | Decision 1 took High to Low instead, as the sketches draw wicks and Murphy defines it; this line is superseded. | parameter |
| Initial break out bar | Always a wide range bar | The breakout requires the wide range flag. | coded |
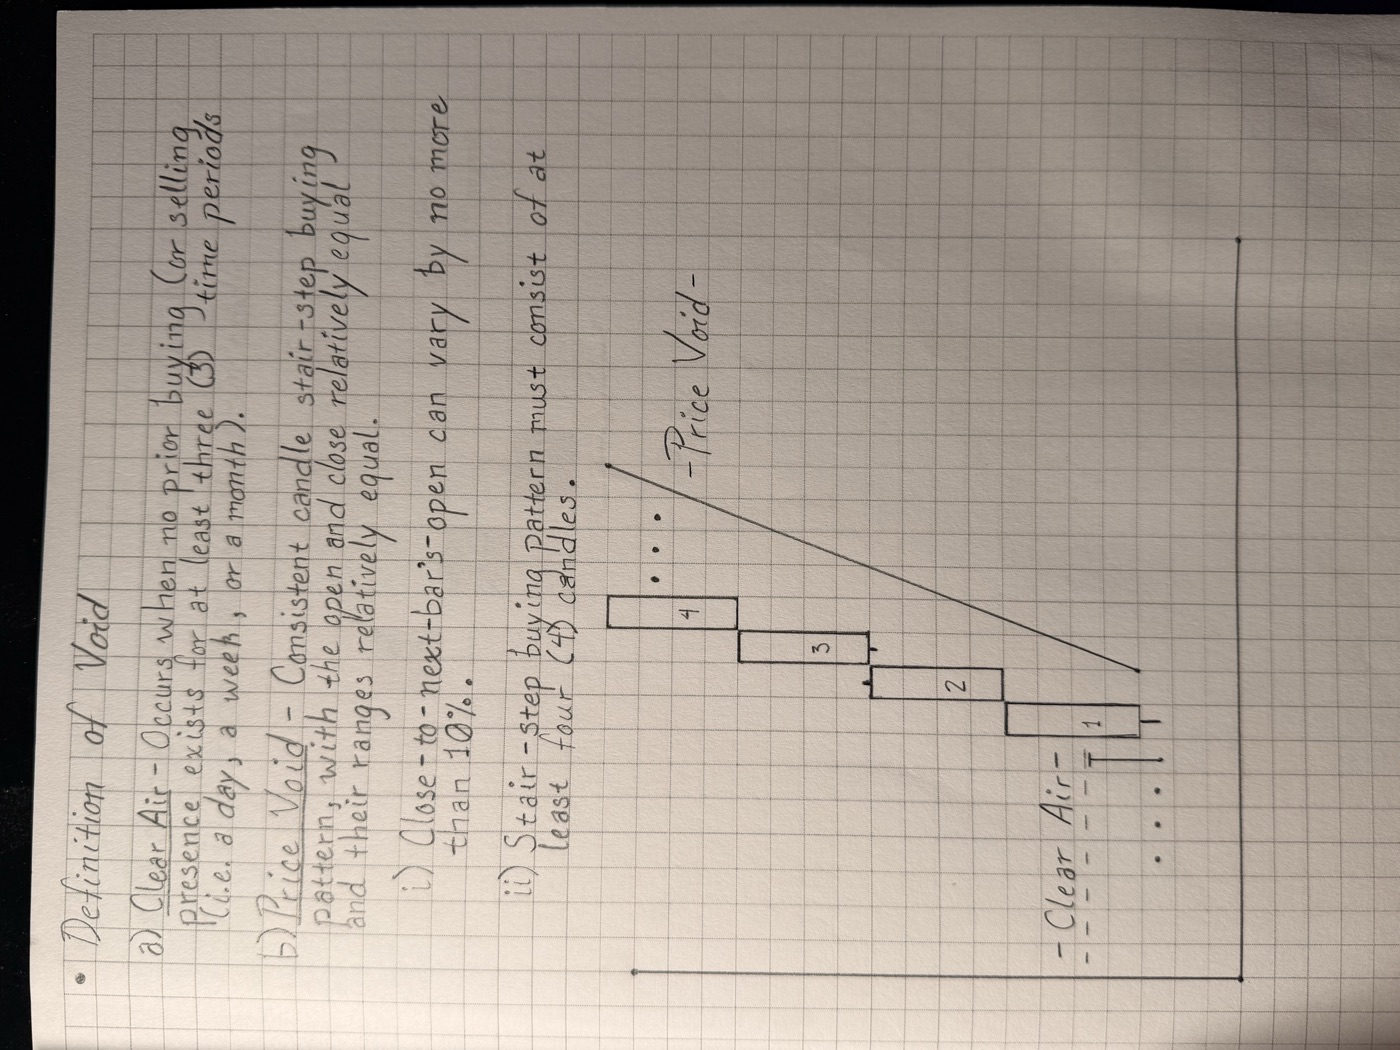
Clear air is price with no recent trading above or below it. A price void is a stair-step of similar candles with no gaps.
| Item | As written | In the code | |
|---|---|---|---|
| Clear air | No prior buying or selling presence for at least three periods | A close above the highest high, or below the lowest low, of the prior three bars (decision 6). | coded |
| Price void | At least four stair-step candles, close-to-next-open within 10%, ranges relatively equal | Four or more consecutive same-direction bars, each opening within a tenth of the prior range from its close, ranges within 1 ATR. Almost never fires on daily bars. | coded |
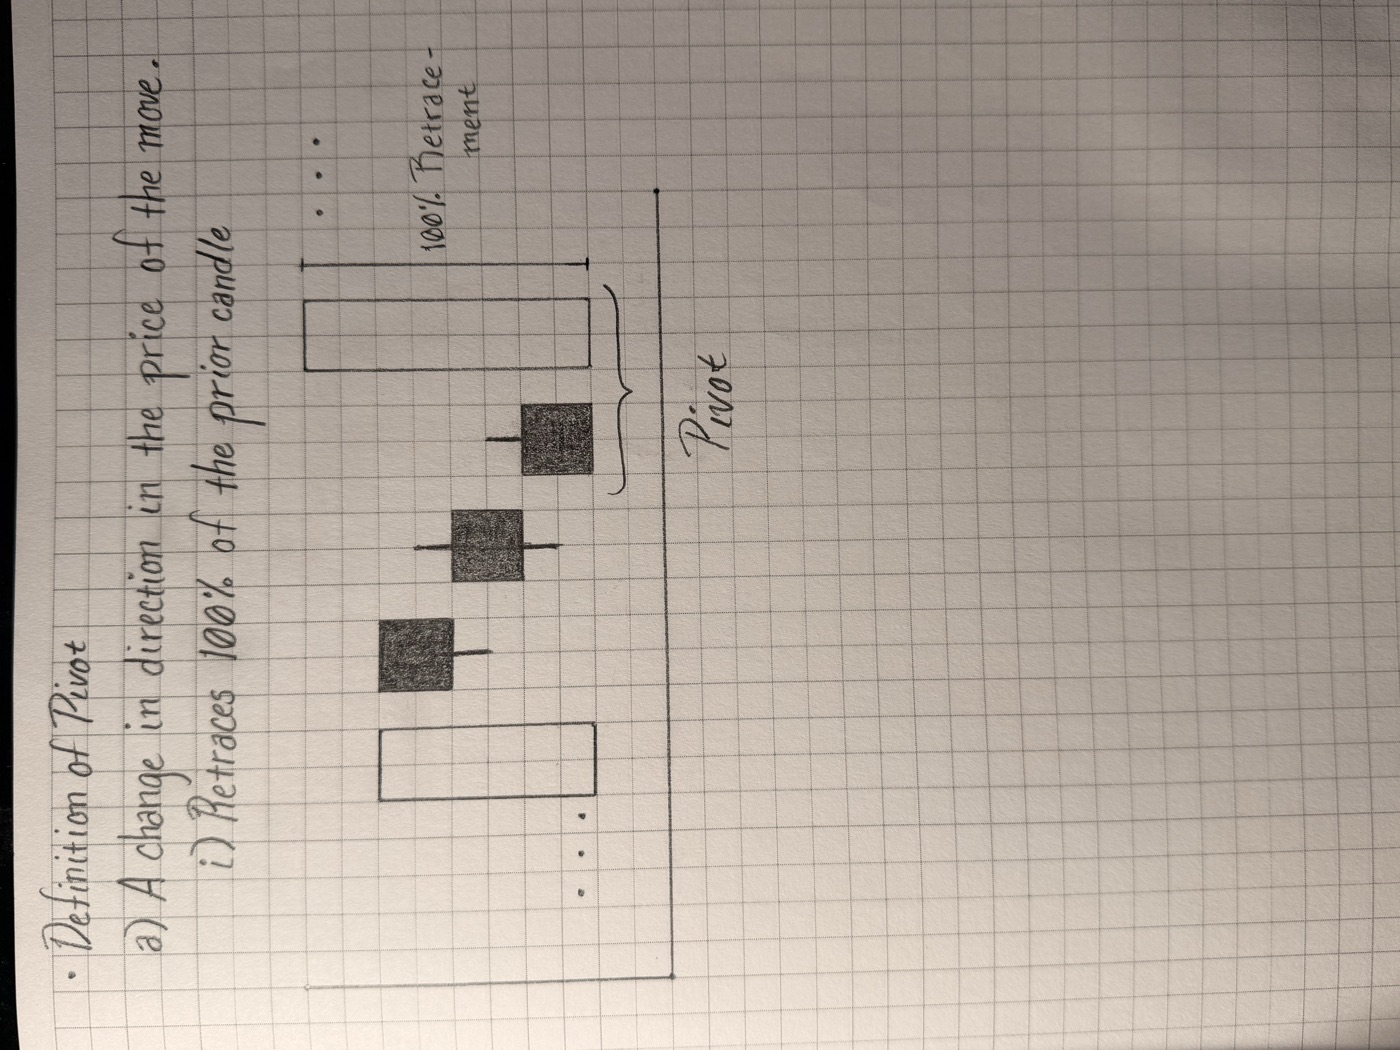
Three filled down candles, then a hollow up candle whose body spans the last one. The bracket says 100% retracement.
| Item | As written | In the code | |
|---|---|---|---|
| Pivot | Retraces 100% of the prior candle | Tested on the body, as the bracket is drawn: the up bar's close reaches the prior bar's open. A single bar can turn the trend, which is why the stage bands flip every few bars; two-bar confirmation is on the chart as a trial. | coded |